Tool #1: The 5 Whys
Sakichi Toyoda, father of the Japanese industrial revolution and Founder of Toyota Industries, invented the 5-Whys technique for problem resolution
Popularized by Toyota in the 1970s, this method is now used across the globe for root cause analysis.
The 5 Whys: Step-by-step Guide
Step 1: State the problem.
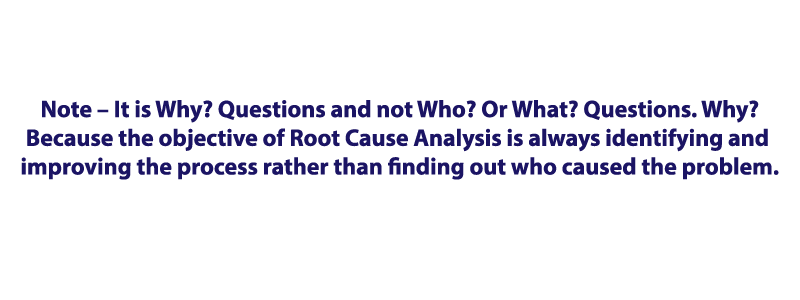
Step 2: Ask yourself, “Why did the problem occur?”
Step 3: Once you’ve come up with a potential reason, ask why that happened.
Step 4: Do this in succession until you’ve asked “why?” Five times or you can extend this further by asking questions until no more ‘Why’ question would be relevant.
Example
Problem Statement - Increase in customer complaints, Decrease in customer satisfaction score
Symptoms - Overworked customer support employees
Why 1? – Why employees have to do excess work?
Answer – Because service volume has increased more than the projection
Why 2? - Why service volume increased?
Answer – Because the failure rate has increased
Why 3? – Why the failure rate increased?
Answer – Because the quality of the heat sink is not as prescribed
Why 4? - Why the quality was not checked during production?
Answer – Prescribed quality sampling ratio is not sufficient
In this example, corrections are
- Recruiting more customer support employees, the problem may not get solved if some other component starts failing
- Change the heat sink purchase from a new vendor, the problem may not get solved if the new vendor or some of the other existing supplier start supplying bad quality product
Corrective Action is increasing the quality sampling ratio and tightening quality checking process.
Tool #2: Flowcharts
Flowcharts are great for visual people, because they lay out all the steps of a process in an easy to digest diagram.
They’re also incredible tools for gaps in the process
Building a Flowchart: Step-by-step Guide
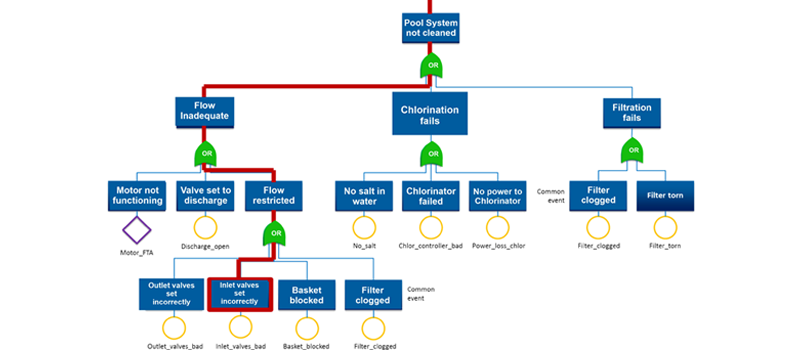
Step 1: Define the problem as the starting block
Step 2: Identify possible causes for the problem and mark as the first level of the tree
Step 3: Identify possible causes for each of the cause identified until no further cause could be identified
Step 4: Collect empirical data about the problem and mark the loop which form the chain of causes for the problem
Step 5: Cause at the last leg of the chain of marked causes is the ROOT CAUSE which need to be addressed.
Tool #3: The Fishbone Diagram
Named as Fishbone Diagram because the diagram looks like a fishbone.
The Fishbone Diagram is used in a structured brainstorming session you could do on your own or with a group.
This method is one of the basic quality tools within Six Sigma, which is a set of techniques for process improvement that has saved companies billions of dollars.
Building a Fishbone Diagram: Step-by-step Guide
Step 1: Define a problem or issue (EFFECT).
Step 2: Construct the skeleton of a fishbone, and name each of the line (You can have any number of lines) coming out of the “spine” into possible CATEGORY of causes. You can choose all possible categories.
Step 3: Conduct a 5-minute brainstorm for each of the categories you just listed. Ask, “How could [People] have caused the issue to occur?” Add responses to the diagram.
Step 4: Collect enough data about the problem and the symptoms. Highlight most likely causes based on the data and discuss possible cause and effect relationship between the identified causes
Step 5: Confirm that the identified causes have actually led to the stated problem based on empirical data. Remove the CAUSES which did not contribute to the problem.
Step 6: All the CAUSES left now in the diagram should have a CAUSE & EFFECT relationship. Identify the ROOT CAUSE which has triggered the other CAUSES to happen.
Example:
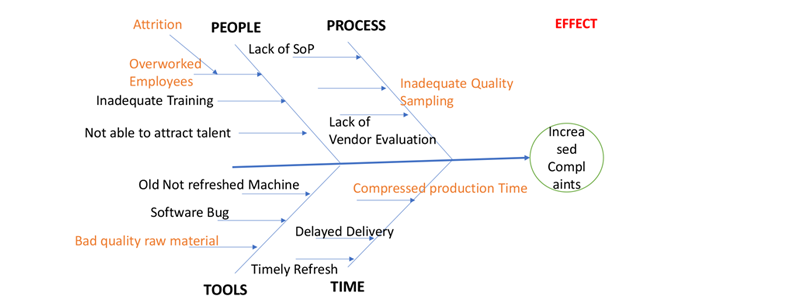
We shall take the same example we solved using ‘5 WHY’ techniques so that you can easily understand the differences between the techniques.
Problem Statement - Increase in customer complaints, Decrease in customer satisfaction score
Symptoms - Overworked customer support employees
Chosen 4 categories of causes i.e. People, Process, Tools & Time. Additional categories can also be selected
Each arrow line indicates a cause and a sub-cause.
Highlighted causes are the possible causes and they are identified to have a cause & effect relationship between them.
ROOT OF the identified CAUSES is “Inadequate Quality Sampling”
There are other techniques for identifying ROOT CAUSE ANALYSIS like Pareto Chart, Brainstorming, etc. We shall not discuss these in this article.
About the Author
Jaganathan T is the Managing Director of IT Services company FutureCalls Technology Private Limited. Jaganathan is an accomplished author and motivational speaker by passion. He has written and published two books ‘Management Immemorial – Learnings from Literature’ and ‘Grandma in The Board Room’. Author can be reached at authorjagan@gmail.com.